By Fake Review Detector
A rating histogram is the bar chart beside a product's star rating showing what share of reviewers gave 5, 4, 3, 2 or 1 stars. Real products form a J-curve: a tall 5-star bar, a solid 4-star bar, a thin middle and a real 1-star tail. An empty middle or 95% five stars means slow down — the reviews may be bought. This guide shows you how to read the shape in 60 seconds, on Amazon, Google, Trustpilot and anywhere else stars are sold.
What a Rating Histogram Is (and Where to Find It)
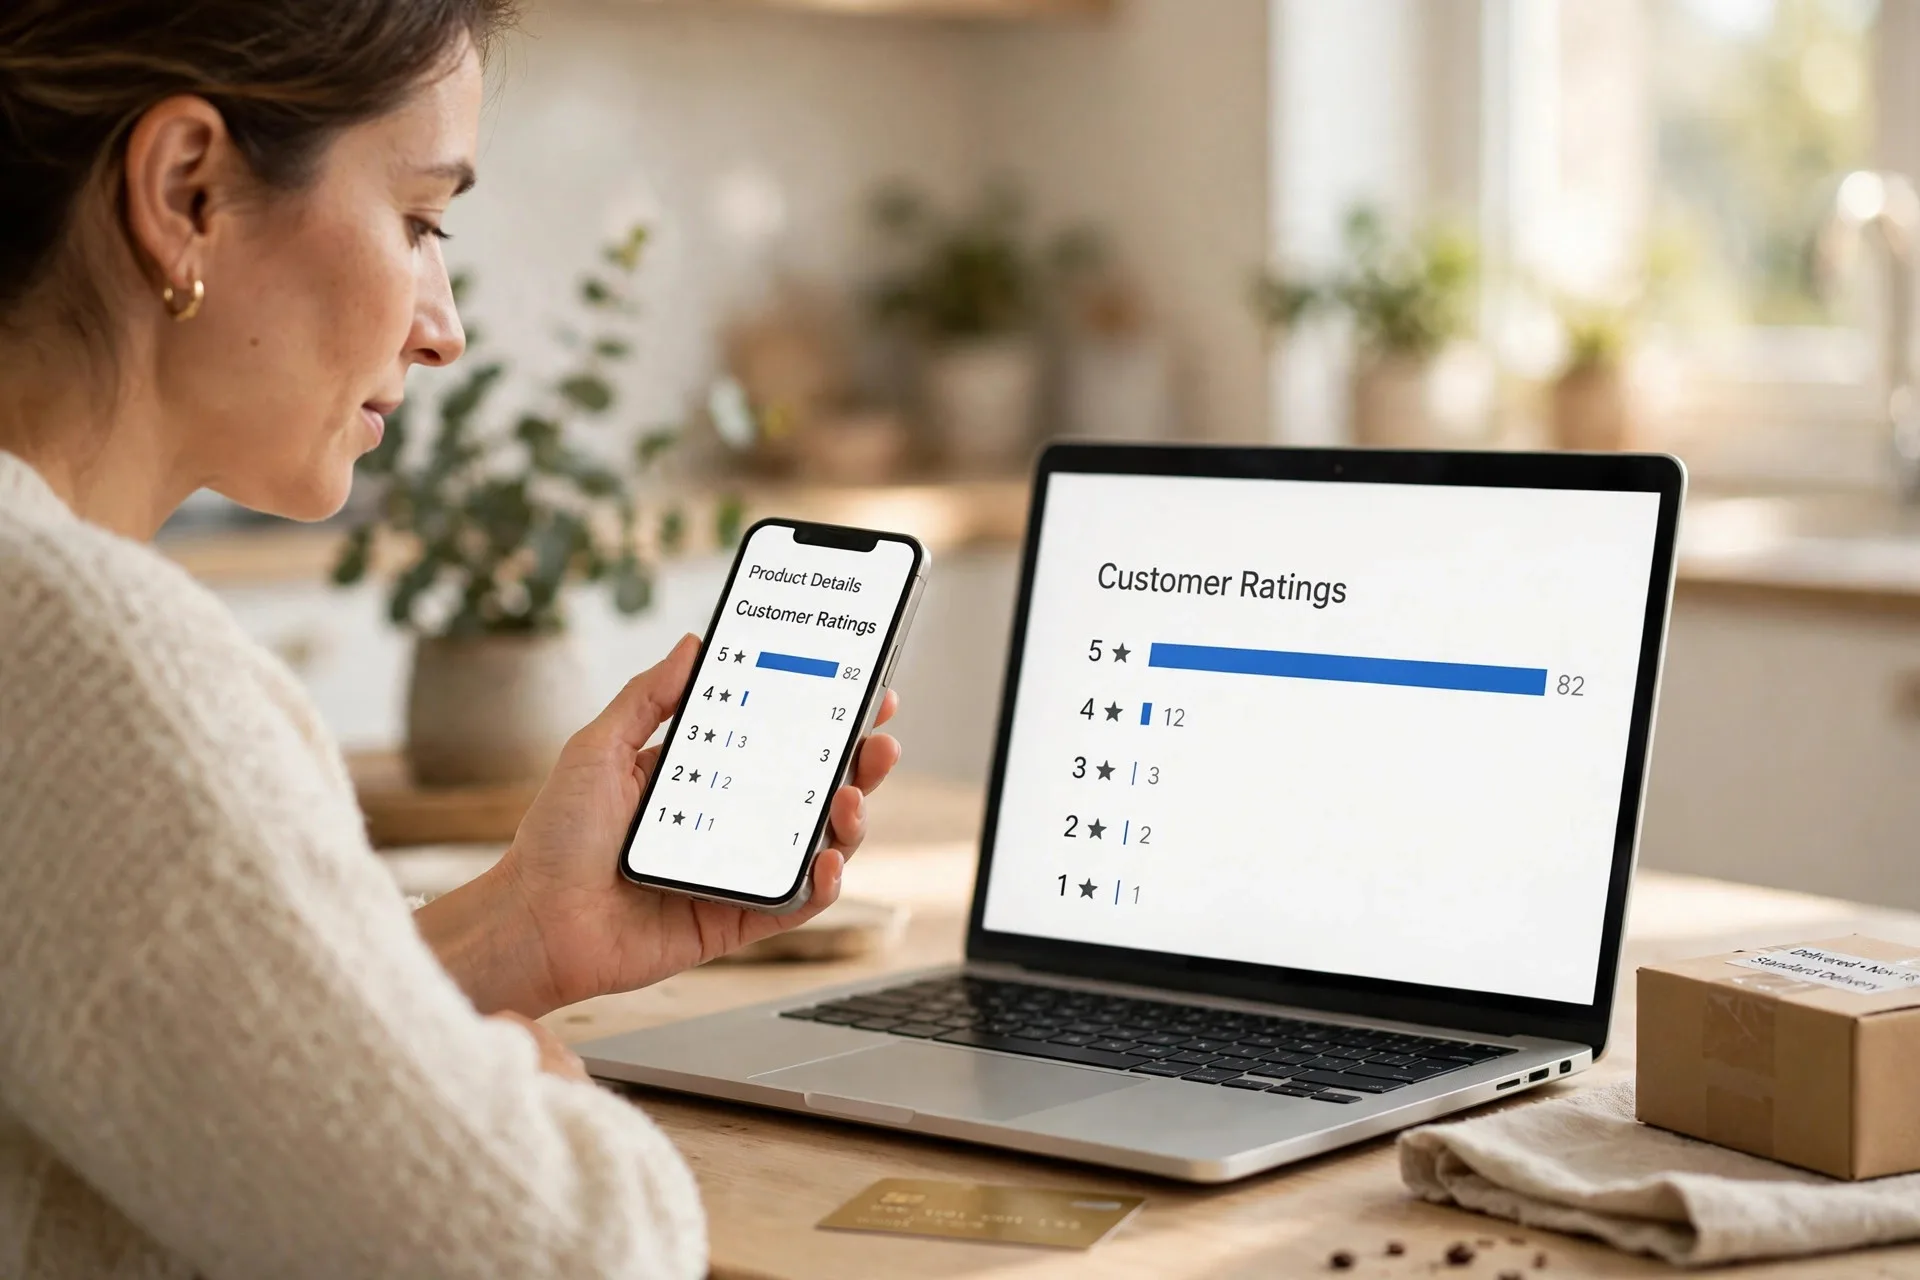
A rating histogram is the breakdown of a star rating into five bars — one per star level. The length of each bar shows what percentage of all ratings sit at that level. It is the single most honest number on a product page, because the headline average hides everything that matters: a 4.6-star product can be loved by nearly everyone, or it can be a battlefield of bought 5-star reviews and furious 1-star buyers. The average looks identical. The histogram tells the truth.
On Amazon.com, Amazon.co.uk, Amazon.de and Amazon.fr, you will find it under the star rating as the "Customer reviews" breakdown — click any bar to filter the reviews to that star level. Google shows a similar bar chart on business profiles and in Google Shopping. Trustpilot shows the star distribution on every company profile. Etsy, eBay, Walmart and most app stores show the same five bars. Wherever you shop in the US or Europe, the histogram is one click away — and almost nobody clicks it.
Two things to know before you read one. First, the bars show shares, not counts: 80% five stars means something very different on 40 reviews than on 4,000. A small sample is noisy, so always check the total number of ratings next to the bars. Second, the histogram only counts ratings, not review text — a star with no words still moves a bar. That is exactly why it is so hard to fake cleanly: buying a thousand convincing reviews is expensive, but buying a thousand silent 5-star clicks still leaves a shape a trained eye can spot.
The Healthy Shape: The J-Curve
Genuine products almost always form a J-curve: a tall 5-star bar, a shorter 4-star bar, a thin 3-star and 2-star middle, and a real 1-star tail. The shape looks like the letter J lying on its side. It is not a flaw — it is what honest human behaviour looks like. People who love a product and people who hate it are the ones who bother to write. The moderate middle — the shoppers who thought it was fine — mostly stay silent. Researchers Hu, Pavlou and Zhang showed this in MIS Quarterly in 2017: review distributions are J-shaped because extreme buyers over-report while the moderate majority stays quiet, which also means the average rating is a biased number. The histogram corrects for that bias by showing you the shape behind the average.
So what does a normal J-curve look like in numbers? Academic research across millions of Amazon reviews puts the typical organic distribution for a well-received product at roughly 60–65% five stars, 12–15% four stars, 5–7% three stars, 4–6% two stars, and 10–15% one stars (Ridge Worldwide statistical analysis, 8 April 2026). An older study of Amazon reviews from February to July 2005 found 78% of book reviews, 73% of DVD reviews and 72% of video reviews were four stars or higher (Hu et al., Communications of the ACM, October 2009) — real products skew positive, but they never skew perfectly.
The most reassuring shape you can see is a J-curve with a small but visible 2–3 star band. That thin middle is the signature of real buyers with real mixed feelings. And the average itself has a sweet spot: research from the Spiegel Research Center at Northwestern University (2017) found purchase likelihood peaks when the average sits between 4.0 and 4.7 stars. A 4.9 or 5.0 average across thousands of reviews is not a better product — it is a product whose histogram you should inspect immediately.
Red Flag 1: The Wall of 5 Stars
The most common fake shape is the wall: 95% or more of ratings at five stars, with almost nothing anywhere else. Real products almost never produce this distribution organically — genuine buyers always find something to complain about, even on a great product: slow shipping, a dented box, a colour slightly different from the photo. When the 1-star, 2-star and 3-star bars are all near zero, the most likely explanation is that the five stars were bought, not earned.
The danger zone starts lower than 95%. Statistical analysis of Amazon listings finds that a five-star share above 75% combined with a near-absence of 2-star and 3-star ratings is a strong marker of incentivised reviews — reviewers paid with refunds or free products almost always leave maximum ratings (Ridge Worldwide, 8 April 2026). The pattern is worst on new listings: a product launched a month ago with 800 reviews and 97% five stars did not earn that in four weeks. It bought it.
AI has made the wall taller. Detection firm Pangram Labs ran its classifier across 30,000 front-page reviews on 500 Amazon bestsellers in May 2026 and found about 3.0% were AI-generated — and 74% of those AI reviews carried five stars, against 59% of human-written ones. Only 10% of AI reviews were one star, against 21% of human reviews. In other words, fake and AI-written reviews pile up at the top of the histogram, and the wall of five stars is where they hide. If you see a wall, read the one-star reviews before anything else — they are usually the only real voices on the page.
Red Flag 2: The U-Shape (Bimodal)
The second fake shape is the U-shape, also called a bimodal distribution: a huge five-star bar, a huge one-star bar, and almost nothing in between. It looks like a valley with two cliffs. This pattern usually means two different forces are fighting on the same listing — a coordinated positive campaign pushing five stars, plus real angry customers (or a competitor attack) pushing one stars. The middle is empty because nobody in the middle was paid to write, and nobody in the middle felt strongly enough to bother.
A U-shape is the most misleading histogram of all, because the average can look perfectly reasonable — a product with 60% five stars and 35% one stars averages around 3.4, which looks like an ordinary mediocre product. It is not ordinary. It is a product where the five-star reviews and the one-star reviews describe two different realities. Read the one-star reviews first: if they all report the same failure — the same broken zip, the same fake serial number, the same item arriving used — while the five-star reviews are vague and generic, you are looking at bought praise on top of a real problem.
The U-shape also appears on hijacked listings. A seller takes over an old listing with thousands of genuine reviews, swaps in a different, cheaper product, and inherits the rating. The old five-star reviews praise a product that is no longer being sold, and the new one-star reviews complain about the product that actually arrived. The histogram shows the crime scene. If the five-star reviews describe a different colour, size or product than the one on sale, walk away.
Red Flag 3: The Sudden Cliff (Read the Histogram Over Time)
A histogram is a snapshot, but fake reviews also leave a time signature — and you can see it by sorting reviews by most recent. The pattern is called the sudden cliff: a clean stream of five stars for weeks, then a sharp drop, or a flood of five stars in a few days followed by silence. Organic reviews trickle in roughly in proportion to sales. A product that collected 50 reviews in two years and then 400 in one month has had a manipulation event, not a sales boom.
Watch the dates around product launches, Black Friday and the Christmas shopping season in particular — fake-review campaigns spike when the money is biggest. Amazon says it blocked more than 275 million suspected fake reviews in 2024 alone, and the UK Competition and Markets Authority accepted binding undertakings from Amazon in June 2025 to strengthen its fake-review detection and punish catalogue manipulation. The platforms are fighting back, which is why the cliff exists: a paid campaign runs, gets detected, gets partially purged, and the histogram drops off a cliff. A listing whose five-star bar is built from a single burst of dates is a listing whose reputation was rented, not earned.
Red Flag 4: The Flat or Uniform Spread
The rarest fake shape is the flat histogram: roughly even bars across all five star levels — 20% five stars, 20% four, 20% three, and so on. Organic data almost never looks like this. Real buyers cluster at the top and the bottom; they do not spread themselves evenly like a textbook bell curve. A flat distribution usually means poorly calibrated review generation — a bot or a bulk-writing operation that did not know what a real histogram looks like and spread its output evenly across the scale.
The flat shape is most common on small, new or obscure listings, and on some Google business profiles where a reputation-management firm has been "balancing" the rating. It is the least common of the four shapes, but it is also the easiest to spot: no real product has a histogram that looks like a staircase. If every bar is the same length, treat the whole page as suspect — including the business itself.
Read the 3-Star Reviews First
Here is the habit that makes the histogram useful: once the shape looks plausible, read the three-star reviews first. Three-star reviews are the least faked category on the internet. There is almost no economic incentive to fabricate them — brands buying reviews want five stars, competitors planting reviews want one star, and incentivised reviewers paid with free products overwhelmingly skew positive. That makes the three-star band the closest thing to ground truth on a product page.
Read five to ten of them. Real three-star reviews sound like real mixed experiences: "the sound is great but the battery only lasts four hours," "good value for €40, but the sizing runs small," "works well, arrived two days late." They name specific details, specific trade-offs, specific numbers. Then read the one-star reviews to see whether the same complaint keeps coming up — one broken unit is bad luck, twenty reports of the same failure is a pattern. Then read the four-star reviews for the balanced view: these are usually happy buyers who noticed a flaw and said so. If the three-star reviews sound generic, hyperbolic or identical to each other, the histogram was probably built, not earned — and the product is not worth your money.
The 60-Second Histogram Routine
Put it together and the whole check takes a minute. Here is the routine, in order:
1. Open the histogram. On Amazon, click the star rating; on Google, open the review summary; on Trustpilot, open the company profile. Never judge a product by the headline average alone.
2. Check the five-star share. Around 60–65% is normal for a good product. Above 75% with an empty middle, slow down. Above 95%, treat it as a wall until proven otherwise.
3. Check the middle exists. A real J-curve has a visible 2-star and 3-star band. A hollow middle means the reviews were bought or the listing was attacked.
4. Check the sample size. A histogram built on 12 reviews proves nothing — and most shoppers agree: BrightLocal's Local Consumer Review Survey 2026 (11 February 2026, 1,002 US adults) found 47% of shoppers will not use a business with fewer than 20 reviews. Five reviews change everything — Spiegel (2017) found a product with five reviews is 270% more likely to be bought than one with none — but five reviews is also the easiest number to fake.
5. Read the three-star reviews. Five to ten of them, looking for specific detail and real trade-offs.
6. Read the one-star reviews. Look for one repeated complaint, and check the dates for bursts.
Platform differences matter. On Amazon, use the star filter and the "Verified Purchase" tag — but remember the tag only proves a purchase happened, not that the review is real, because refund schemes are built to earn it. On Google, a business with hundreds of reviews and no three-star band at all is worth a second look. On Trustpilot, check whether the reviews are "invited" or organic — invited reviews skew positive by design. On Etsy and eBay, where sellers are people rather than brands, the histogram of the seller matters as much as the histogram of the product. And if a single review looks suspicious, paste the review text into our fake review checker and let it analyse the wording for you.
What a Histogram Can't Tell You
A histogram is a clue, not a verdict. A healthy J-curve does not guarantee the reviews are real — a careful operator can buy a realistic-looking spread. And a strange shape does not prove the reviews are fake — a genuinely bad product can earn a real U-shape, and a genuinely great one can earn a wall of five stars from delighted customers. The histogram tells you where to look, not what to conclude. Combine it with the reviewer profiles, the review dates, the Verified Purchase tags and the words themselves before you decide.
That matters because the stakes are real money. The US Federal Trade Commission estimates that fake reviews influence over $152 billion in consumer spending every year, and since 21 October 2024 its Fake Review Rule (16 CFR Part 465) has made buying or selling fake reviews a federal violation, with civil penalties of more than $53,000 per violation. In the UK, the Digital Markets, Competition and Consumers Act 2024 brought fake-review provisions into force in April 2025, and the EU's Digital Services Act requires marketplaces to act on reports of fake reviews. The law is catching up — but on the day you buy, the histogram is still the fastest protection you have. Sixty seconds, five bars, and you will know more than the star rating ever told you.
Related reading: J-Curve Rating Distribution: The Clearest Signal a Product's Reviews Are Real — https://fakereviewdetector.org/blog/j-curve-rating-distribution-clearest-signal-2026 · How Many Reviews Do You Need to Trust a Product? — https://fakereviewdetector.org/blog/how-many-reviews-do-you-need-to-trust-a-product-2026 · The 4 Signals of a Fake Review — https://fakereviewdetector.org/blog/the-4-signals-of-a-fake-review-2026 · How to Read Review Patterns — https://fakereviewdetector.org/blog/how-to-read-review-patterns · How to Spot Fake Reviews — https://fakereviewdetector.org/blog/how-to-spot-fake-reviews-2026
Frequently Asked Questions
Q: What is a rating histogram?
A: A rating histogram is the bar chart beside a product's star rating that shows what share of all ratings are 5, 4, 3, 2 and 1 stars. Amazon, Google, Trustpilot, Etsy and eBay all show one. It tells you how the rating is distributed, which the headline average hides.
Q: What does a normal rating histogram look like?
A: A healthy histogram forms a J-curve: roughly 60–65% five stars, 12–15% four stars, 5–7% three stars, 4–6% two stars and 10–15% one stars, with a visible thin middle. The average usually sits between 4.0 and 4.7 stars. A small but visible 2–3 star band is the most reassuring sign of all.
Q: Is 90% five-star ratings always fake?
A: Not always — a genuinely excellent product with a loyal customer base can earn a high five-star share. But 90% or more five stars, especially on a new listing or with an empty middle, is a strong warning sign. Above 75% five stars with almost no 2-star or 3-star ratings, statistical analysis points to incentivised reviews. Check the three-star and one-star reviews before you decide.
Q: Why are 3-star reviews the most trustworthy?
A: Because nobody pays for them. Brands buying reviews want five stars, competitors planting reviews want one star, and incentivised reviewers overwhelmingly leave five stars. Three-star reviews are written by real buyers describing real mixed experiences, which is why they are the closest thing to ground truth on a product page.
Q: Can a product with a perfect histogram still have fake reviews?
A: Yes. A histogram is a clue, not proof. A careful operator can buy a realistic-looking spread, and a genuine product can have a strange shape. Always combine the histogram with the review dates, the reviewer profiles and the review text itself — and if a review looks suspicious, paste the review text into our fake review checker before you buy.
Next time you are about to buy something online, spend 60 seconds on the histogram before you spend a dollar. Open the bars, check the five-star share, make sure the middle exists, and read the three-star reviews. If the shape is a clean J-curve and the middle reviews sound like real people, buy with confidence. If it is a wall, a U-shape or a flat spread, walk away — or paste the review text into our fake review checker and let the evidence decide.
Sources: Hu, Pavlou & Zhang, MIS Quarterly, 2017 (J-shaped review distributions); Hu et al., Communications of the ACM, October 2009 (Amazon review distribution, February–July 2005); Spiegel Research Center, Northwestern University, 2017; BrightLocal Local Consumer Review Survey 2026, 11 February 2026 (n=1,002 US adults); Pangram Labs, May 2026 (30,000 reviews, 500 Amazon bestsellers); Ridge Worldwide statistical analysis, 8 April 2026; Boxumer detection guide, 27 May 2026; Amazon (275 million suspected fake reviews blocked in 2024); US Federal Trade Commission (Fake Review Rule, 16 CFR Part 465, effective 21 October 2024); UK Competition and Markets Authority, 6 June 2025.